

NEW LISTING
$2,300,000
3566 County Road 2522, Royse City 75189
6 _iconbed_ | 7 _iconbath_ | 6,645 SF | 10.10 AC

Where 1920s Main Street charm meets new neighborhoods, acreage, and room to breathe.
Platted in 1886 by Garrett “Byrd” Royse, who helped bring the MK&T Railroad through town, Royse City has somehow managed to hold onto a lot of its history while growing like crazy around it. Once built around cotton, railroads, and a true small-town economy, Royse City is now home to more than 28,000 residents and has become one of the fastest-growing communities in North Texas.
What I like about Royse City is that it doesn’t feel like just one thing. You can tour a brand-new home in a master-planned community in the morning, look at acreage or a custom home that afternoon, and still end up downtown surrounded by historic brick buildings that have been part of the city for generations.
The downtown area has real personality too. Royse City is a Texas Main Street community, and you’ll find local businesses, casual places to eat, the Zaner Robison Historical Museum, and even a tiny one-room jail dating back to somewhere between 1911 and 1921. Add traditions like Music on Main and the Lighted Christmas Parade, and it still feels like a place where people actually show up for their town.
At the same time, you’re right on I-30 with newer shopping, restaurants, and development continuing to pop up around you. And yes, Royse City has a Buc-ee’s. That probably tells you more about how much this place has grown than any population chart ever could.
Royse City is one of those places where two homes with the same city on the mailing address can offer completely different lifestyles. One may be in a big amenity-filled neighborhood, another may sit on acreage, and another may be tucked closer to old downtown. Knowing the difference between those areas matters, especially with as quickly as this part of town is changing.
“Royse City is one of my favorite examples of old and new actually working together. You can still feel the history downtown, but then drive five minutes and be looking at brand-new construction, acreage, or a custom home with room to spread out. There really isn’t one version of Royse City, and that’s exactly why knowing the different neighborhoods matters.”
— Steavy Carter
| Feature | Why It Matters |
|---|---|
| Primary Zip Code | 75189 |
| Market Style | New construction, master-planned communities, acreage properties, custom homes, and older neighborhoods closer to town |
| Key Neighborhoods | Waterscape, Creekshaw, Verandah, High Point Ranch, Vista Oaks Estates |
| Downtown Character | Historic brick buildings, local businesses, Texas Main Street roots, and community events that still feel very Royse City |
| Vibe Check | A real old Texas town growing fast around the edges, with new neighborhoods, acreage, and enough personality left in the middle to keep it interesting. |
Thinking about Royse City but not sure whether you want new construction, a neighborhood with amenities, something closer to downtown, or a little land? Browse the latest homes below, or call Steavy directly at 214.502.3390. We’ll show you around and help you figure out which version of Royse City actually fits you.
Swipe, use two fingers on a trackpad, or use the arrows to bring a home into focus. Swipe to bring a home into focus.


You can try reloading the preview, open the full listing in a new tab, or close this window.
A curated look at local favorites, everyday stops, and lifestyle context near this property.
Royse City is booming, but it has completely held onto its historic charm. We are constantly pointing our clients to these three spots—whether it's grabbing world-class BBQ, relaxing on a Main Street patio, or making the ultimate Texas pit stop.

If you know us, you know Buc-ee's is our absolute go-to for 'Welcome to Texas' gifts for our clients. Hearing 'Fresh brisket on the board!!' is a whole experience. We always load up on Beaver Nuggets, Brisket, the Texas Cheese Steak wrap, Banana Pudding, and Candied Roasted Pecans. And if you see Sean wearing a trucker hat, it's probably one of their amazing $12 finds. Do not leave without checking out the alpaca saddle blankets!
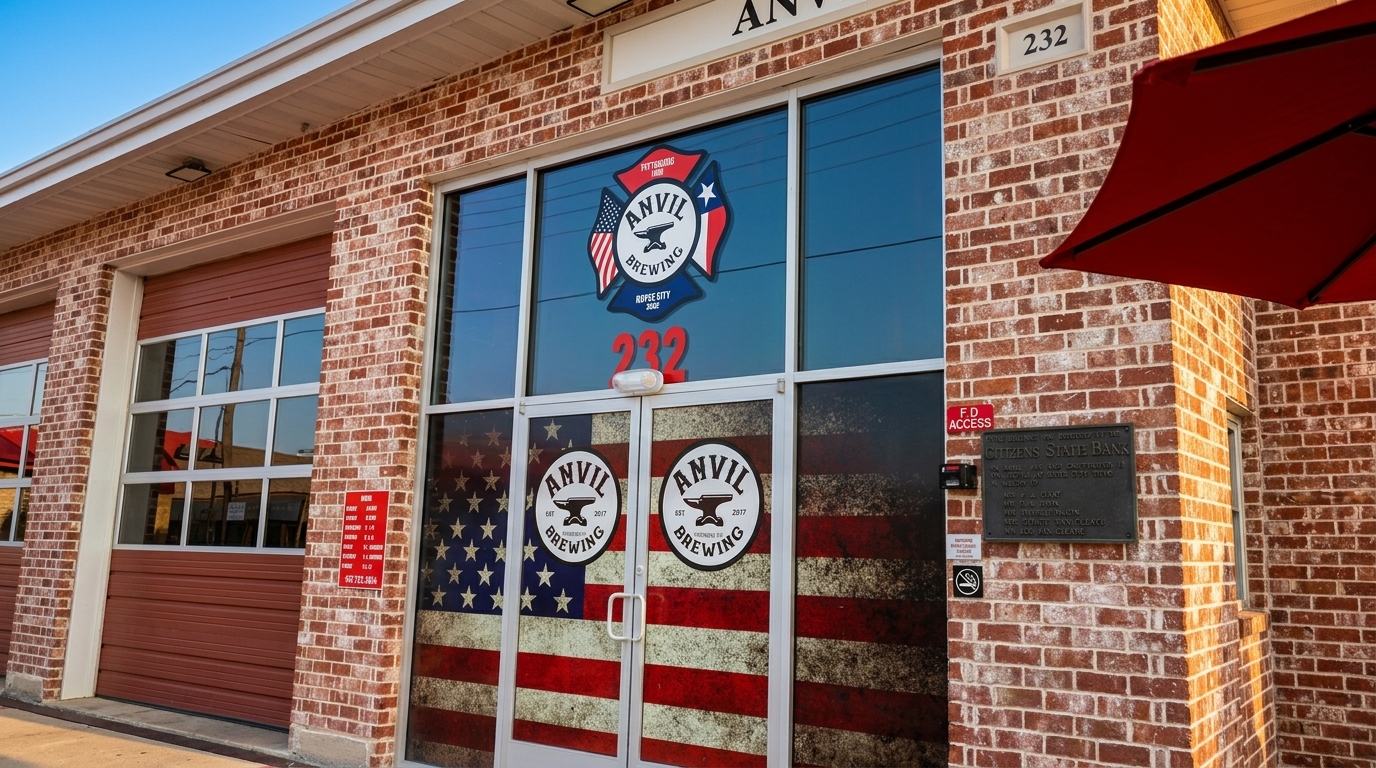
Housed in the former Royse City Fire Department built in 1982, The Anvil has incredible character. They throw open the three roll-top garage doors on nice days so you can enjoy their small-batch beer on the patio right on Main Street. If you go for happy hour, you have to get the Giant 13-inch Soft Pretzel for the table. Otherwise, their Fried Green Tomato BLT and the loaded Chicken Salad Sandwich on a croissant are absolutely sinful.
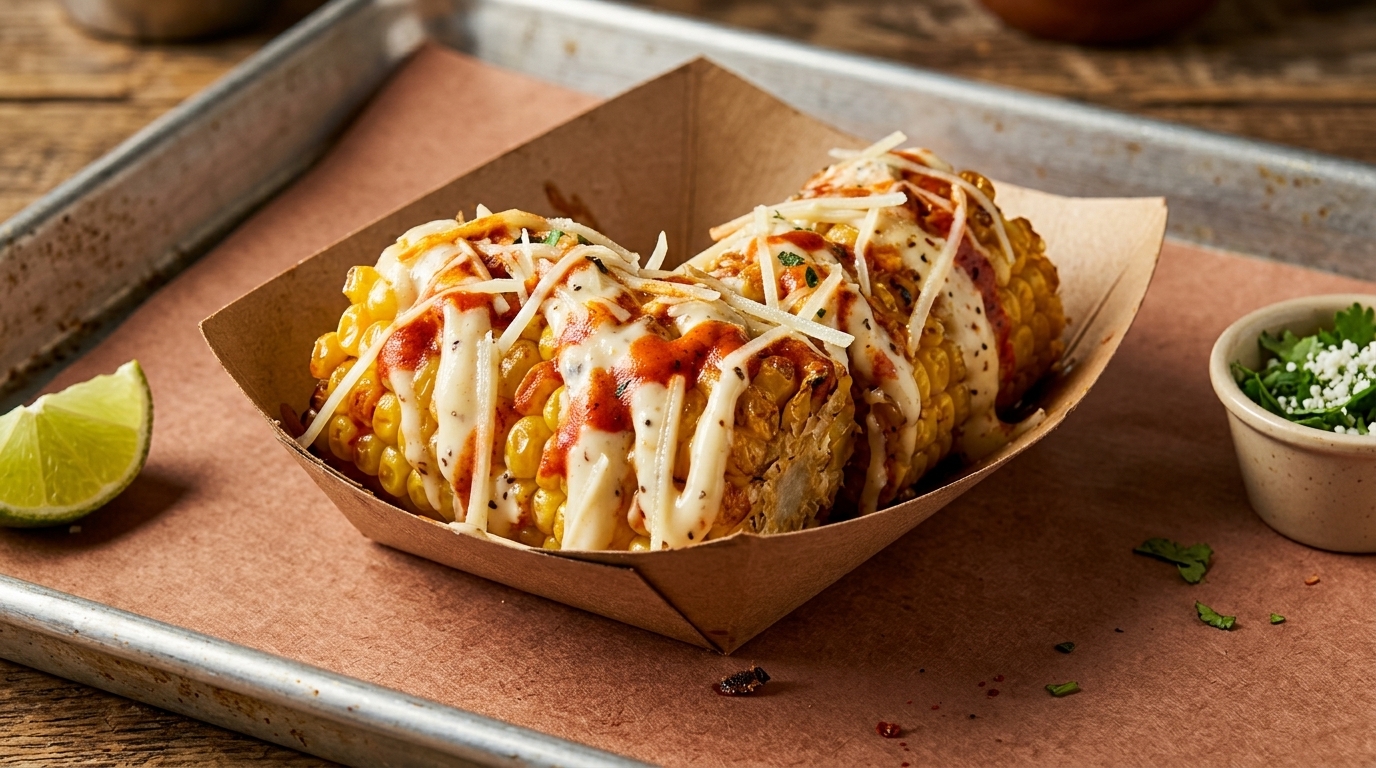
This place is legitimately putting out some of the best barbecue in Texas. Their 'Sessions Burger'—made with two prime brisket patties and garlic peppercorn aioli—is unbelievable. But whatever you do, you cannot skip the Fried Street Corn. It is fried in house-made beef tallow and topped with cilantro, tajin, and parmesan. If you happen to go on a Wednesday, grab their special Garlic Parmesan Ribs before they sell out.
Explore the full map below — it shows my curated local favorites for the area, plus the closest spots for everyday errands, things to do, and picks for Him, Her, and Date Night.
Royse City buyers are securing strong advantages as median sold prices trend over four percent below original list expectations. Typical properties are closing at $329,495, which sits roughly 4.1% below their county appraisal values. Furthermore, sellers are providing concessions in over 70% of transactions to help finalize deals. The typical seller-paid concession stands at a median of $8,000.
Buyers face excellent conditions with nearly 56 percent of active listings seeing price reductions to attract offers. Mid-priced homes between $300,000 and $370,000 are offering the highest frequency of seller concessions at 83.3%. In addition, homes are spending a median of 61 days on the market before closing, giving house hunters ample time to negotiate. Over 21% of pending sales recently cancelled, returning more options to active status.
Sellers must price competitively from the start as homes are closing approximately $15,416 below their original list price. Properties that close below their county appraised value are spending a median of just 39 days on the market, while those selling above take 60 days. Providing financial help at the closing table is becoming standard, with the overall concession rate reaching 70.6%. First-time buyer tier listings face the highest rate of active price reductions at 67.1%.
Mid-tier properties lead in frequency of seller-paid financial assistance.
Entry-level homes face the steepest competition requiring price adjustments.
Active supply sits high while closing velocity remains steady.
51.5% of sellers in the Royse City area priced above the county's Central Appraisal District (CAD) value — here’s what happened to each group.
Royse City market analysis · Multiple verified sources
Most homes are closing slightly below their assessed values, signaling a shift in pricing leverage toward buyers. The median sold price settled at $329,495, which is 4.1% below the county appraisal district valuations. Interestingly, properties that do sell below their assessed value close much faster at a median of 39 days on the market, compared to 60 days for those closing above.
Buyers are successfully obtaining substantial closing cost assistance to finalize their home purchases. Sellers are offering financial concessions in 70.6% of all closed transactions. The median seller-paid concession stands at a solid $8,000, which amounts to roughly 2.7% of the typical purchase price.
An increasing number of active properties are sitting on the market and requiring price adjustments to attract buyers. Active inventory shows that 56.1% of listings have undergone price decreases. This is particularly pronounced in the entry-level tier, where 67.1% of homes have lowered their asking prices. Additionally, 21.1% of pending sales have cancelled recently, up 6.4 percentage points year-over-year.
Over the trailing three months, the median sold price for homes was $329,495. Properties spent a median of 61 days on the market before securing a buyer. Final closed prices reached a median of 95.8% of their original list prices, reflecting a median discount of $15,416. Furthermore, homes broadly sold 4.1% below their county appraised values, indicating a cooling off from peak pandemic-era assessments.
Concessions remain highly prevalent, occurring in 70.6% of closed transactions overall. The mid-priced tier, ranging from $300,000 to $370,000, saw the highest rate of seller assistance at 83.3%, with a median contribution of $10,000. Starter homes also saw frequent help, with a 70.7% concession rate and a median amount of $7,700, while the luxury tier showed the least reliance on seller assistance at just 42.9%.
 MLS 21384022
 MLS 21370434
 MLS 21360525
MLS 21421883
 MLS 21380636
 MLS 21397762
MLS 21421310
 MLS 21408866
 MLS 21402568
 MLS 21368733
 MLS 21410676
 MLS 21364088
 MLS 21393815
 MLS 21401358
 MLS 21401434
 MLS 21358364
 MLS 21373120
 MLS 21362305
 MLS 21417483
MLS 21373228
 MLS 21346770
 MLS 21359694
 MLS 21369307
 MLS 21359206
 MLS 21351281
 MLS 21349842
 MLS 21329605
 MLS 21370909
 MLS 21376938
 MLS 21371768
 MLS 21351166
 MLS 21347445
 MLS 21371202
 MLS 21351221
 MLS 21388190
 MLS 21408030
 MLS 21412749
 MLS 21408203
 MLS 21410418
 MLS 21399478
 MLS 21351295
 MLS 21409851
MLS 21420560
 MLS 21375268
 MLS 21410398
 MLS 21350957
 MLS 21360393
 MLS 21409888
 MLS 21383496
 MLS 21372120
 MLS 21403548
MLS 21420712
 MLS 21350270
 MLS 21383385
 MLS 21416658
 MLS 21354994
 MLS 21359707
 MLS 21341006
MLS 21421479
MLS 21419962
 MLS 21356975
 MLS 21344767
 MLS 21414827
 MLS 21406765
 MLS 21353572
 MLS 21365175
 MLS 21340993
 MLS 21376118
 MLS 21383632
 MLS 21392678
 MLS 21347366
 MLS 21377551
 MLS 21368322
 MLS 21366743
 MLS 21359554
 MLS 21415062
 MLS 21410695
 MLS 21350959
 MLS 21408159
 MLS 21379522
 MLS 21390757
 MLS 21337176
 MLS 21350164
 MLS 21371044
MLS 21420750
 MLS 21369795
 MLS 21391119
MLS 21423530
 MLS 21360271
 MLS 21416079
 MLS 21347024
 MLS 21312947
 MLS 21356388
 MLS 21404513
MLS 21420261
 MLS 21393224
 MLS 21369746
 MLS 21339534
 MLS 21358043
 MLS 21350193
 MLS 21403924
 MLS 21378924
 MLS 21407027
 MLS 21404536
MLS 21422537
 MLS 21386686
 MLS 21393319
 MLS 21348584
 MLS 21416683
 MLS 21358865
 MLS 21360313
 MLS 21337083
 MLS 21393549
 MLS 21404540
MLS 21421539
 MLS 21409714
 MLS 21394272
 MLS 21411433
 MLS 21369031
 MLS 21361677
 MLS 21416843
 MLS 21385333
 MLS 21413237
 MLS 21394214
 MLS 21353172
 MLS 21365833
 MLS 21337093
 MLS 21369733
 MLS 21351954
 MLS 21343922
 MLS 21337152
 MLS 21369368
 MLS 21377196
MLS 21423346
 MLS 21389748
 MLS 21337205
 MLS 21396431
 MLS 21396331
 MLS 21404640
 MLS 21393110
 MLS 21389713
 MLS 21368074
MLS 21416149
 MLS 21396763
 MLS 21389506
 MLS 21396422
 MLS 21396306
 MLS 21369349
 MLS 21337005
 MLS 21407001
 MLS 21394740
 MLS 21397615
 MLS 21364471
 MLS 21342367
 MLS 21377476
 MLS 21357202
 MLS 21404154
 MLS 21394639
 MLS 21364361
 MLS 21362671
 MLS 21352292
 MLS 21376275
 MLS 21369326
 MLS 21359425
 MLS 21344661
 MLS 21368086
 MLS 21360598
 MLS 21391113
 MLS 21352805
 MLS 21405829
 MLS 21370948
 MLS 21396415
 MLS 21396042
 MLS 21363303
 MLS 21393144
 MLS 21366259
 MLS 21412275
 MLS 21346610
 MLS 21396292
 MLS 21378138
 MLS 21386049
 MLS 21407937
 MLS 21392323
 MLS 21368112
 MLS 21390240
 MLS 21395835
 MLS 21364220
 MLS 21352924
 MLS 21364748
 MLS 21344691
 MLS 21396395
 MLS 21418182
 MLS 21403608
 MLS 21412261
 MLS 21401266
 MLS 21353124
 MLS 21403884
 MLS 21394264
 MLS 21402390
 MLS 21414157
 MLS 21390700
 MLS 21396249
 MLS 21382763
 MLS 21408011
 MLS 21405981
 MLS 21354378
 MLS 21390728
 MLS 21359894
 MLS 21389163
 MLS 21396408
 MLS 21399539
 MLS 21344597
 MLS 21336134
 MLS 21400516
 MLS 21364510
 MLS 21344606
 MLS 21416808
 MLS 21396076
 MLS 21367200
 MLS 21406990
 MLS 21397726
 MLS 21400646
 MLS 21345860
 MLS 21390763
 MLS 21370535
 MLS 21354730
 MLS 21396401
 MLS 21366936
 MLS 21347362
 MLS 21385483
 MLS 21383826
 MLS 21408050
 MLS 21394284
 MLS 21377888
 MLS 21354459
 MLS 21370894
 MLS 21378157
 MLS 21375426
 MLS 21408963
 MLS 21412317
 MLS 21392315
 MLS 21356784
 MLS 21368606
 MLS 21410152
 MLS 21355161
 MLS 21381554
 MLS 21391978
 MLS 21375646
 MLS 21354347
 MLS 21352928
 MLS 21331555
 MLS 21410154
 MLS 21410149
 MLS 21339640
 MLS 21359972
 MLS 21415310
 MLS 21409230
 MLS 21392249
 MLS 21358270
 MLS 21396831
 MLS 21357518
 MLS 21391295
 MLS 21412944
 MLS 21411201
 MLS 21353455
 MLS 21344858
 MLS 21412312
 MLS 21394253
 MLS 21394247
 MLS 21369419
 MLS 21369403
 MLS 21412326
 MLS 21340169
 MLS 21387755
 MLS 21383245
 MLS 21361580
 MLS 21400229
 MLS 21400237
 MLS 21408552
 MLS 21410529
 MLS 21369730
 MLS 21373709
 MLS 21349676
 MLS 21419156
 MLS 21411050
 MLS 21408376
 MLS 21383119
 MLS 21406041
 MLS 21352573
 MLS 21371964
 MLS 21392539
 MLS 21386232
 MLS 21389002
 MLS 21376720
 MLS 21397418
 MLS 21359404
MLS 21421068
 MLS 21253529
MLS 21420189
 MLS 21355330
Current upper-tier listings shown for area context. Market statistics reflect the sources, geographies and reporting periods identified in this report.
The active market is characterized by a strong Buyer's Advantage with an Altos Market Action Index of 27.9. There are 608 active listings carrying a median asking price of $344,950 and a median 77 days on market. Notably, 56.1% of these active listings have decreased their price, led by the first quartile where a significant 67.1% of listings have implemented price cuts.
Buyer hesitancy is evident in the contract phase, as 21.1% of pending sales were cancelled, representing an increase of 6.4 percentage points year-over-year. The number of cancelled sales jumped 45.8% compared to the same period last year. Conversely, the number of delisted properties fell by 31.2% year-over-year, and relisted properties dropped by 30.0%, suggesting sellers are choosing to hold firm on the market rather than pulling their listings completely.
Zooming out to the broader Rockwall County benchmark, the market currently holds 6.1 months of inventory with 1,251 active listings at the end of the period. Single-family building permits reached 124 for the month, a 5.3% decrease year-over-year. Total closed dollar volume for the county increased by 4.4% year-over-year, despite the median close price dipping by 3.4% to $430,000.
Want the numbers behind the report?
| Closed Sales Metric | Observed Value |
|---|---|
| Median Sold Price | $329,495 |
| Median Price / Sq Ft | $158 |
| Median Days on Market (DOM) | 61 days |
| Median Cumulative Days on Market (CDOM) | 66 days |
| Sold / Final List Ratio | 98.7% |
| Sold / Original List Ratio | 95.8% |
| Final List / Original List Ratio | 98.0% |
| Difference From Original Ask (%) | -4.2% |
| Difference From Original Ask ($) | -$15,416 |
| Appraisal Position Metric | Observed Difference |
|---|---|
| Original Asking Position vs CAD (%) | +0.1% |
| Original Asking Position vs CAD ($) | $477 |
| Closing Position vs CAD (%) | -4.1% |
| Closing Position vs CAD ($) | -$14,416 |
| Asking-to-Closing Position Gap | 4.19 percentage points |
| Pricing Position | Share (%) | Matched Sales | Price Reduction Rate | CDOM |
|---|---|---|---|---|
| Above CAD | 51.5% | 70 | 62.9% | 60 days |
| Below CAD | 48.5% | 66 | 43.9% | 45 days |
Sellers are attempting to price above county valuations, but final sale prices are ultimately closing below them.
| Tier | Price Range | Sales | Median $/Sq Ft | Median DOM | Concession Rate | Typical Concession |
|---|---|---|---|---|---|---|
| Starter | $132,500–$299,990 | 92 | $149 | 58 days | 70.7% | $7,700 |
| Mid-Priced | $299,990–$369,999 | 78 | $154 | 66 days | 83.3% | $10,000 |
| High-Priced | $370,000–$650,000 | 78 | $179 | 56 days | 62.8% | $10,000 |
| Luxury (low sample) | $670,000–$1,600,000 | 14 | $243 | 68 days | 42.9% | $7,500 |
| Blended Total | All Price Tiers | 262 | $158 | 61 days | 70.6% | $8,000 |
*Low sample size in Luxury tier (<15 sales); interpret this segment cautiously.
| Altos Market Summary | Current Metric |
|---|---|
| Market Action Index (MAI) | 27.93 |
| Market Condition | Buyer's Advantage |
| MAI One Month Ago | 28.83 |
| Median Asking Price | $344,950 |
| Median Asking Price / Sq Ft | $162.28 |
| Median Days on Market (DOM) | 77 days |
| Active Listings With Price Decreases | 56.1% |
| Active Listing Count | 608 |
| Quartile | Median Price | $/Sq Ft | Median Sq Ft | Lot Size | Beds | Baths | Median DOM | Mean DOM | % Decreased | % Relisted | Count |
|---|---|---|---|---|---|---|---|---|---|---|---|
| Entry-Level | $268,245 | $152.49 | 1,726 | 0.15 ac | 4 | 2.0 | 91 | 117.3 | 67.1% | 3.3% | 152 |
| Lower-Middle | $320,000 | $157.13 | 2,015 | 0.14 ac | 4 | 2.0 | 70 | 108.6 | 54.0% | 8.6% | 152 |
| Upper-Middle | $378,332 | $167.22 | 2,301 | 0.14 ac | 4 | 3.0 | 77 | 113.5 | 52.0% | 3.3% | 152 |
| Luxury (Top 25%) | $521,750 | $196.98 | 2,919 | 0.82 ac | 4 | 3.0 | 63 | 108.4 | 51.3% | 5.9% | 152 |
| Blended Total | $344,950 | $162.28 | 2,114 | 0.15 ac | 4 | 2.5 | 77 | 112.0 | 56.1% | 5.3% | 608 |
| Behavior & Contract Metric | Monthly Total | Count YoY | Current Share | Share YoY |
|---|---|---|---|---|
| Active Listings with Price Drops | 148 | -3.9% | 48.8% | +2.4 pts |
| Delisted / Off-Market Without Sale | 29 | -31.2% | 9.5% | -3.1 pts |
| Relisted Properties | 7 | -30.0% | 2.3% | -0.7 pts |
| Pending Contracts Cancelled | 20 | +45.8% | 21.1% | +6.4 pts |
| Royse City Metric | Current Value | YoY Change (%) |
|---|---|---|
| Closed Sales | 225 | -0.4% |
| YTD Closed Sales | 1,463 | +2.6% |
| Dollar Volume | $122,247,145 | +4.4% |
| Median Close Price | $430,000 | -3.4% |
| Average Close Price | $543,320 | +4.9% |
| Active Listings (End of Month) | 1,251 | N/A |
| Months of Inventory | 6.12 mos | N/A |
| Building Permit Metric | Current Value | YoY Change (%) |
|---|---|---|
| Single-Family Permits | 124 units | -5.3% |
| Total Permit Valuation | $45,684,517 | +12.4% |
| Average Permit Value | $368,424 | +18.8% |